0% read
마지막 업데이트:
Candlesticks
캔들스틱은 특정 기간 동안 자산의 가격 변동을 표시하기 위해 금융 시장에서 사용되는 그래픽 표현입니다. 쌀 거래를 위해 일본에서 시작되었으며, 시장 심리를 분석하고 잠재적인 가격 변동을 예측하기 위해 암호화폐 거래자에게 필수적인 도구가 되었습니다. [1] [2]
암호화폐 비교
Candlesticks과(와) 가격 및 기타 지표를 비교할 자산을 선택하세요.
생태계 맵
Candlesticks이(가) 연결된 위키와 그 관계를 맵에서 살펴보세요.
개요
캔들스틱 차트는 정의된 기간 내에서 시가, 종가, 최고가 및 최저가 정보를 포함하는 가격 정보를 표시하는 시각적 방법을 제공합니다.
18세기에 일본 쌀 거래자들이 개발한 캔들스틱은 암호화폐 거래를 포함한 현대 금융 시장에서 기술적 분석을 위한 가장 인기 있고 효과적인 도구 중 하나로 발전했습니다 [1].
시각적 특성 덕분에 거래자는 시장 심리를 빠르게 해석하고 잠재적인 추세 반전 또는 지속을 식별할 수 있으므로 빠른 의사 결정이 종종 필요한 변동성이 큰 암호화폐 시장에서 특히 유용합니다.
캔들스틱 분석은 "후행" 지표가 아닌 "선행" 지표로 간주되는데, 이는 완전히 실현되기 전에 잠재적으로 미래 가격 변동을 나타낼 수 있음을 의미합니다. 이러한 특성으로 인해 캔들스틱 패턴 인식은 매우 역동적인 환경에서 시장 변화를 예측해야 하는 암호화폐 거래자에게 필수적인 기술입니다 [1].
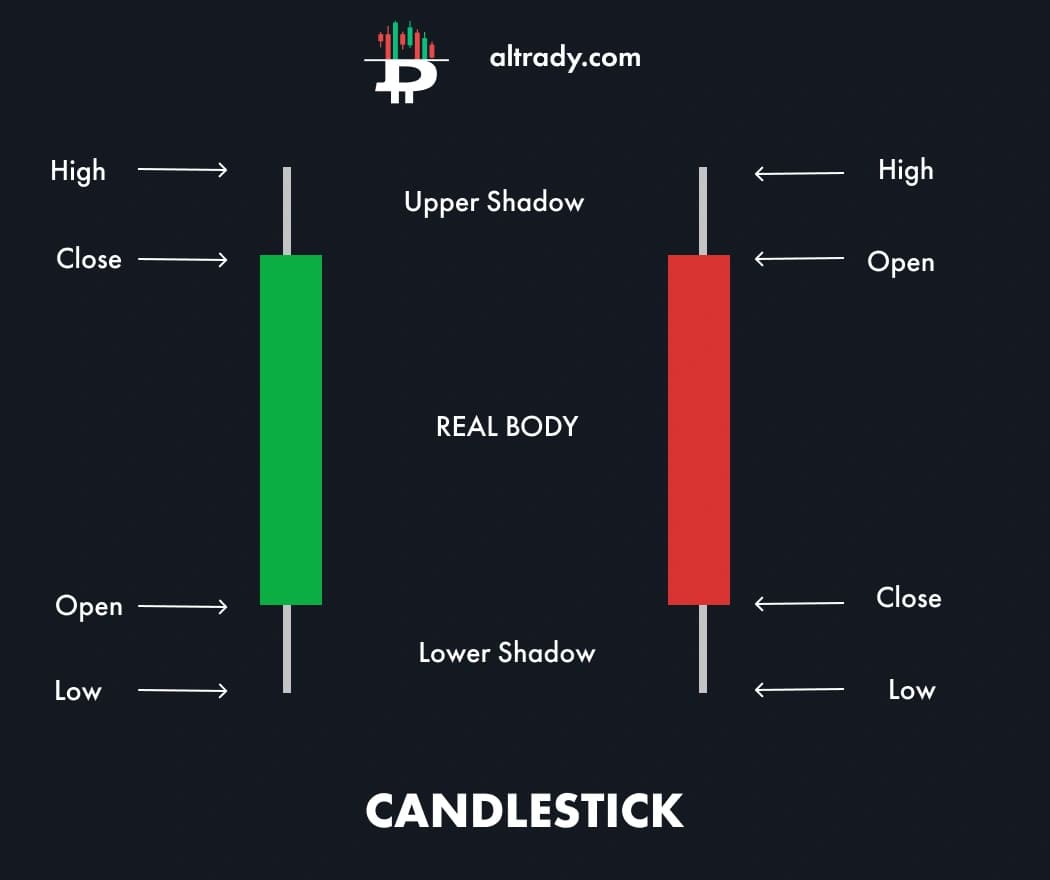
캔들스틱의 구조
캔들스틱은 포괄적인 가격 정보를 제공하는 여러 주요 구성 요소로 구성됩니다.
몸통
캔들스틱에서 가장 눈에 띄는 부분으로, 지정된 기간 동안 시가와 종가 사이의 범위를 나타냅니다. 몸통의 색상은 해당 기간 동안 가격이 상승했는지 하락했는지 나타냅니다 [2].
꼬리 (그림자)
몸통 위아래로 뻗어 있는 가느다란 선은 해당 기간 동안 도달한 최고가와 최저가를 나타냅니다. 위쪽 꼬리는 최고가를 나타내고 아래쪽 꼬리는 최저가를 나타냅니다 [3].
색상 코딩
- 상승 캔들: 일반적으로 녹색 또는 흰색으로, 종가가 시가보다 높았음을 나타냅니다 (가격 상승).
- 하락 캔들: 일반적으로 빨간색 또는 검은색으로, 종가가 시가보다 낮았음을 나타냅니다 (가격 하락) [4].
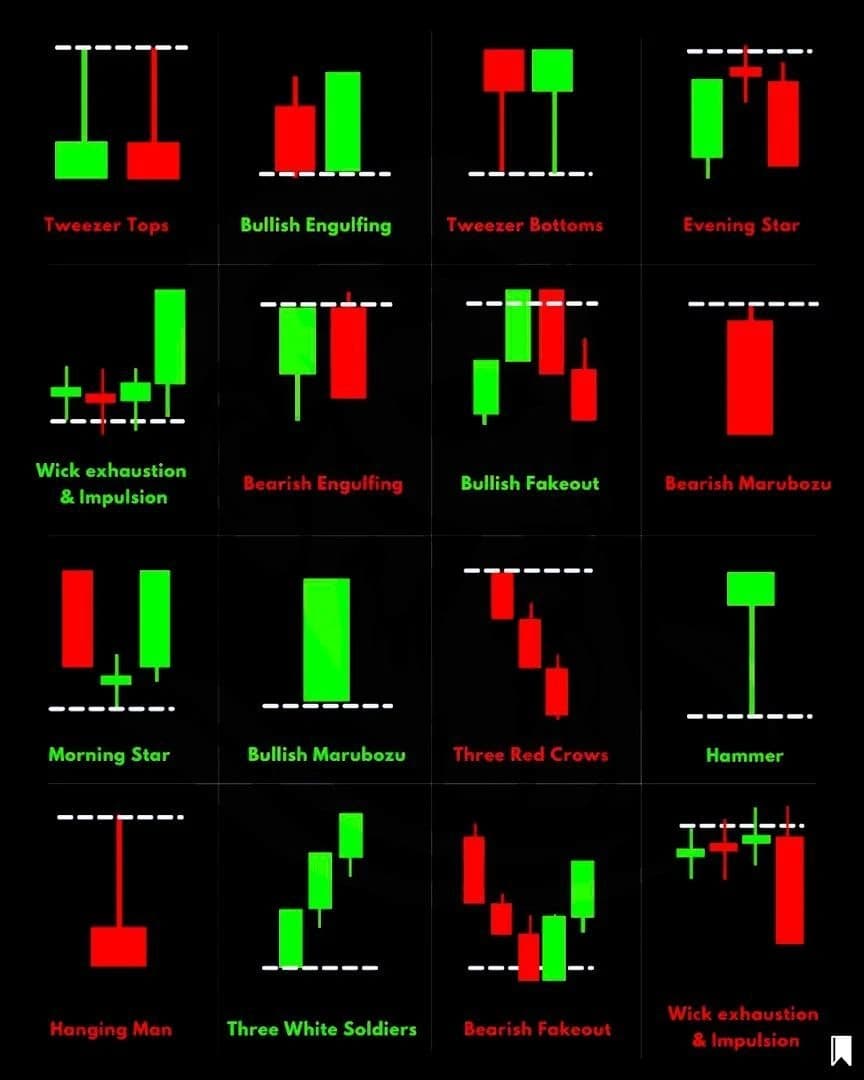
캔들스틱의 종류
다양한 캔들스틱 형성은 시장 상황에 대한 구체적인 통찰력을 제공합니다.
장대 양봉/음봉
몸통이 큰 캔들스틱은 시가와 종가 사이에 상당한 가격 변동이 있음을 나타냅니다. 상승 장대 양봉은 강력한 상승 움직임을 나타내고, 하락 장대 음봉은 상당한 매도 압력을 나타냅니다 [4].
짧은 캔들
이것들은 몸통이 작고 시가와 종가 사이에 차이가 거의 없습니다. 종종 시장 통합 또는 추세의 일시 중지를 나타내며 낮은 변동성을 시사합니다 [4].
도지 캔들
도지는 시가와 종가가 거의 동일하기 때문에 몸통이 거의 없습니다. 이 패턴은 시장의 망설임과 잠재적인 추세 반전 또는 통합을 나타냅니다. 일본어 용어 "도지"는 "같음" 또는 "미결정"을 의미합니다 [4].
팽이형 캔들스틱
이것들은 위아래로 긴 꼬리가 있는 작은 몸통을 가지고 있으며, 구매자와 판매자 모두 우위를 점하지 못하여 시장의 불확실성을 나타냅니다. 상승 및 하락 추세 모두에서 나타날 수 있으며 종종 잠재적인 횡보 움직임을 시사합니다 [4].
망치형 캔들스틱
이것들은 꼬리가 없고 몸통만으로 구성됩니다. 상승 망치형은 최고점에서 마감되어 강력한 매수 압력을 나타내고, 하락 망치형은 최저점에서 마감되어 강력한 매도 압력을 나타냅니다. 일본어 용어 "마루보즈"는 "대머리" 또는 "머리카락 없음"을 의미합니다 [4].
캔들스틱 패턴
캔들스틱 패턴은 잠재적인 시장 움직임을 나타낼 수 있는 여러 캔들스틱으로 생성된 형성입니다.
하락 캔들스틱 패턴
이러한 형성은 잠재적인 하락 추세를 나타내며 종종 상승 추세의 끝에서 나타나 시장 반전을 알립니다. 일반적인 예는 작은 상승 캔들이 더 큰 하락 캔들에 의해 완전히 "감싸지는" 하락 장악 패턴입니다 [4].
상승 캔들스틱 패턴
이러한 패턴은 잠재적인 상승 추세를 시사하며 종종 하락 추세 이후에 발생하여 구매자가 통제력을 얻고 있음을 나타냅니다. 상승 장악 패턴은 큰 상승 캔들이 이전의 작은 하락 캔들의 몸통을 완전히 "감싸는" 대표적인 예입니다 [4].
캔들스틱 차트 읽기
효과적인 기술적 분석을 위해서는 캔들스틱 차트를 해석하는 방법을 이해하는 것이 중요합니다.
시간 프레임
캔들스틱 차트는 분에서 월까지 다양한 기간을 나타낼 수 있습니다. 시간 프레임은 패턴의 중요성에 영향을 미칩니다. 더 긴 시간 프레임 (일, 주)의 패턴은 일반적으로 더 짧은 시간 프레임 (분, 시간)의 패턴보다 더 큰 비중을 갖습니다 [4].
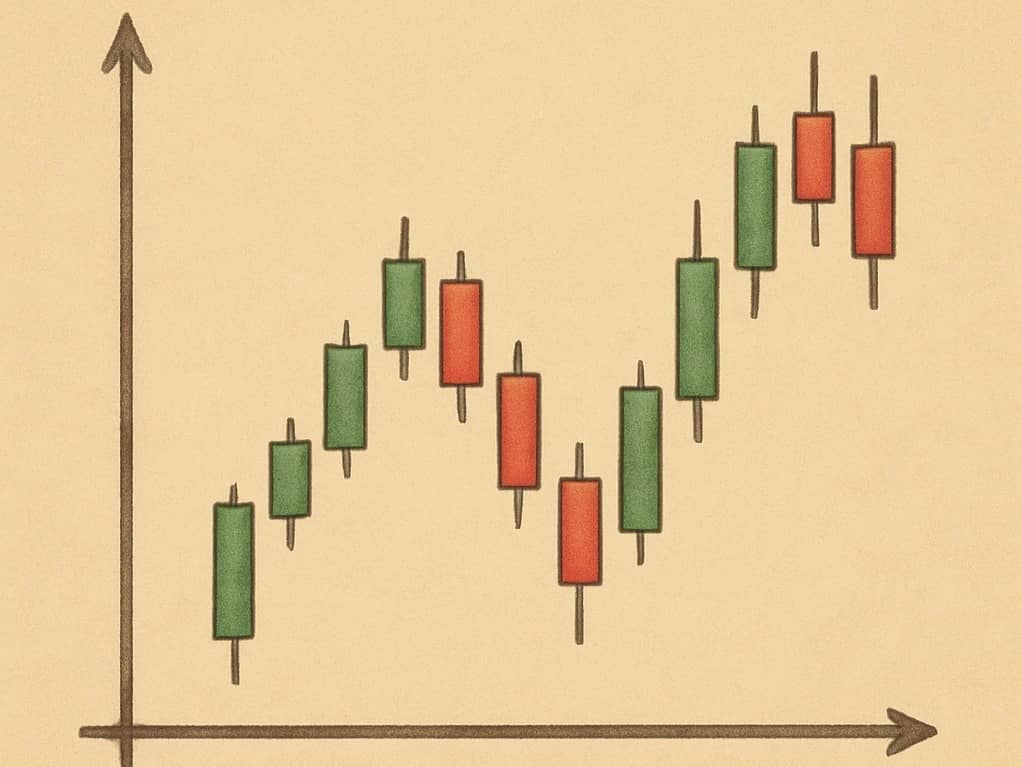
추세 식별
캔들스틱 시퀀스를 관찰함으로써 거래자는 시장이 상승 추세, 하락 추세 또는 횡보 추세에 있는지 확인할 수 있습니다. 연속적인 녹색 캔들은 상승 추세를 시사하고, 연속적인 빨간색 캔들은 하락 추세를 나타냅니다 [4].
패턴 인식
특정 캔들스틱 패턴을 식별하면 거래자가 잠재적인 가격 변동을 예측하는 데 도움이 됩니다. 예를 들어 상승 장악 패턴은 다가오는 상승 추세를 시사할 수 있는 반면, 도지 형성은 시장의 망설임과 잠재적인 추세 반전을 나타낼 수 있습니다 [1].
변동성 평가
꼬리의 길이는 시장 변동성에 대한 통찰력을 제공합니다. 긴 꼬리는 가격이 개장/종가 범위로 돌아가기 전에 상당히 높거나 낮은 수준에 도달했음을 나타내며 높은 변동성을 시사합니다. 짧은 꼬리는 변동성이 적음을 나타냅니다 [3].
암호화폐 거래에서의 중요성
캔들스틱 차트는 다음과 같은 여러 가지 이유로 암호화폐 거래에서 특히 유용합니다.
시장 심리 분석
캔들스틱은 시장 심리에 대한 시각적 단서를 제공하여 거래자가 구매자와 판매자 중 누가 통제하고 있는지 판단하는 데 도움이 됩니다. 이는 빠른 심리 변화를 경험할 수 있는 암호화폐 시장에서 특히 중요합니다 [2].
초기 추세 감지
선행 지표로서 캔들스틱 패턴은 완전히 실현되기 전에 잠재적인 추세 반전을 나타낼 수 있으므로 거래자에게 빠르게 움직이는 암호화폐 시장에서 우위를 제공합니다 [1].
다른 지표와의 통합
캔들스틱 분석은 거래량, 이동 평균 또는 모멘텀 오실레이터와 같은 다른 기술 지표와 결합하여 보다 포괄적인 거래 전략을 만들 수 있습니다. 이러한 다각적인 접근 방식은 거래자가 복잡한 암호화폐 시장에서 더 많은 정보를 바탕으로 결정을 내리는 데 도움이 됩니다 [4].
다양한 거래 스타일에 대한 적응성
거래자가 데이 트레이딩, 스윙 트레이딩 또는 장기 투자에 집중하든 캔들스틱 차트는 다양한 거래 전략에 맞게 다양한 시간 프레임으로 조정할 수 있습니다. 이러한 유연성 덕분에 모든 유형의 암호화폐 거래자에게 유용합니다 [4].
역사적 맥락
캔들스틱 차트 기법은 18세기 일본에서 쌀 거래자들이 시장 가격과 패턴을 추적하기 위해 개발했습니다. 사카타의 전설적인 쌀 거래자인 혼마 무네히사가 이 방법을 만든 것으로 알려져 있습니다. 이 기법은 나중에 1990년대에 스티브 니슨에 의해 서구 세계에 소개되었으며 이후 신흥 암호화폐 부문을 포함한 다양한 금융 시장에서 기술적 분석의 기본 도구가 되었습니다 [4].
잘못된 내용이 있나요?
평균 평점
아직 평가가 없습니다
경험은 어땠나요?
빠른 평가를 해서 우리에게 알려주세요!
편집자
May 14, 2025. 13:30 UTC
편집 요약:
changed image